Data Tracking
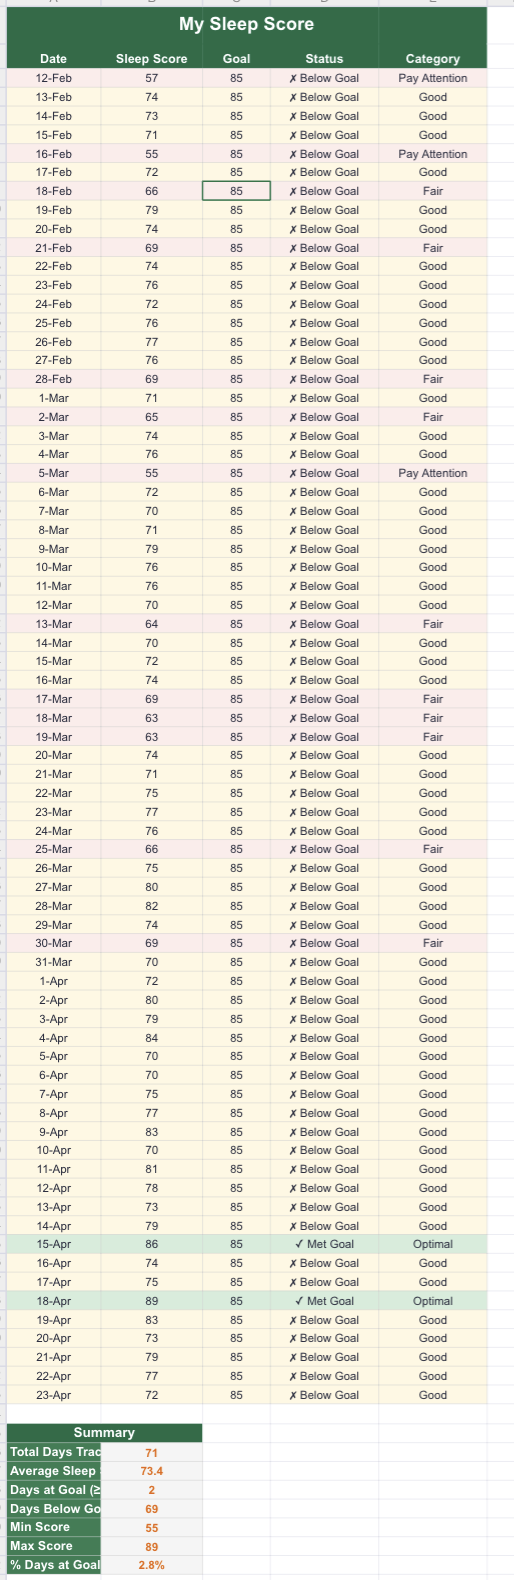
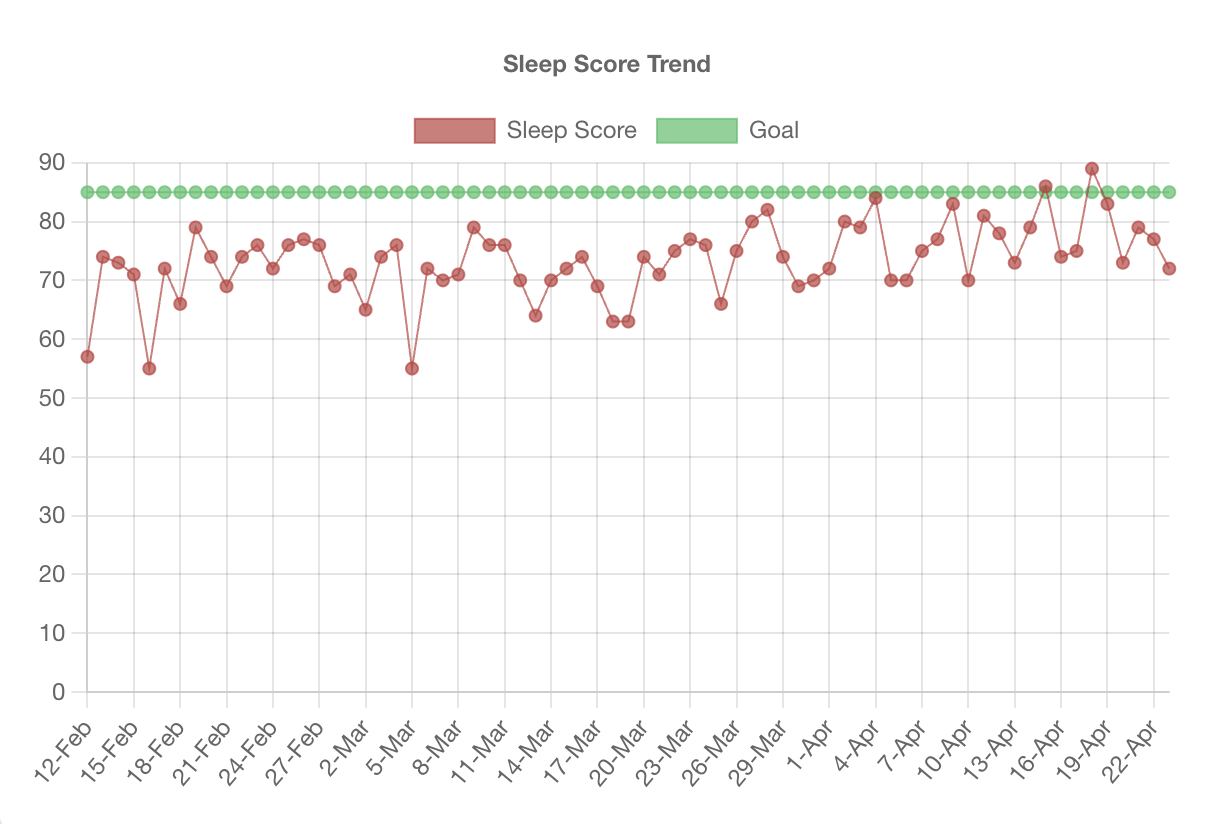
For this data tracking activity, I focused on measuring my daily sleep score over the course of several months, setting a goal of 85 points per night. I collected this data using my Garmin Forerunner 265, logging each night’s result and compiling it into charts to better visualize patterns and trends over time.
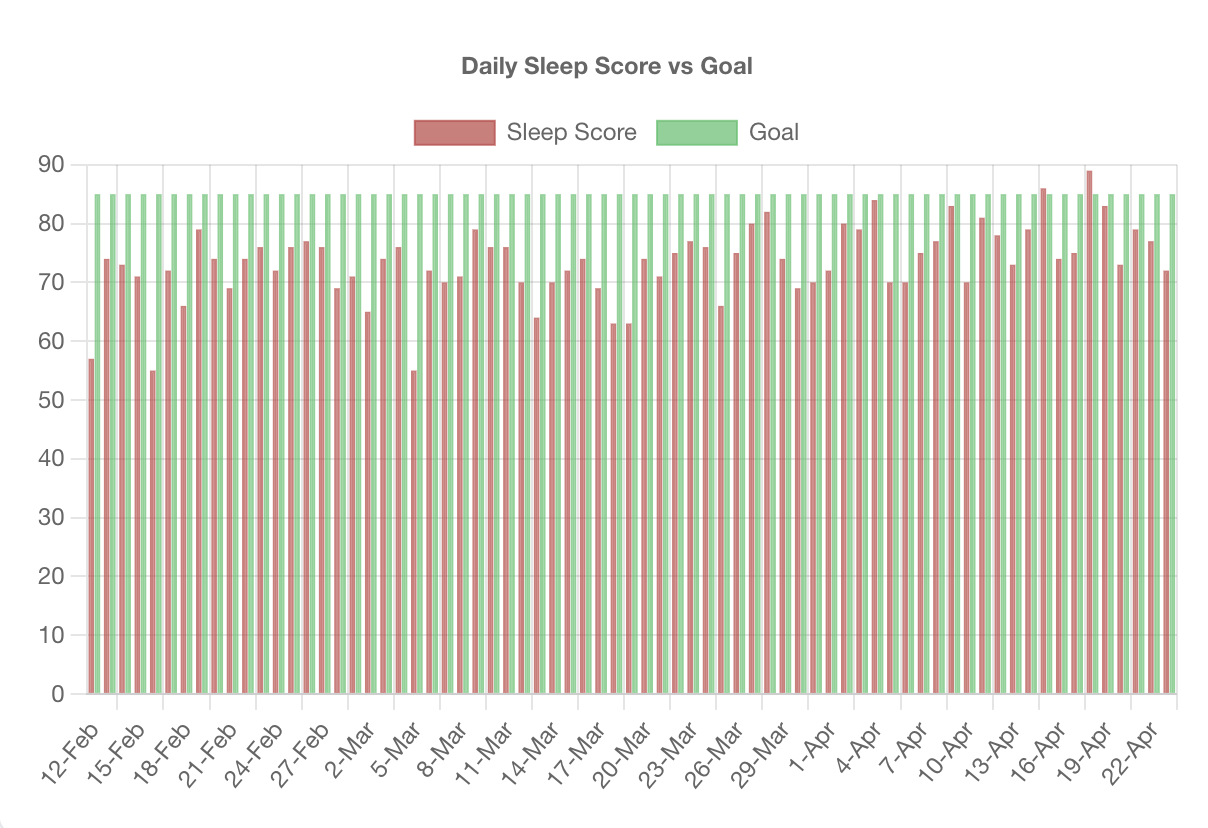
After collecting the data, I analyzed both daily consistency and overall averages. The visualizations made it easy to identify which nights I hit my goal and where I fell short, reinforcing how small, consistent habits accumulate into meaningful long-term patterns.
To better understand these results, I used line and bar charts to highlight trends. Seeing the data laid out visually made patterns clear in a way raw numbers alone never could.